DevSecOps Course Labs
Running Jaeger
Jaeger is a distributed tracing system - it collects and stores traces, and gives you a web UI to find and visualize them. Jaeger originally used its own data format, but it also supports OpenTelemetry.
You can run Jaeger in a production configuration with different features running in different processes, swapping out the data store or adding a message queue to buffer collection.
Reference
-
Jaeger architecture - mapping to OpenTelemetry terminology
-
Instrumenting apps with OpenTelemetry - which can be collected by Jaeger
Run Jaeger
We'll run a simple configuration of Jaeger, where all the components run in a single Docker container:
- jaeger.yml - specifies a Jaeger container, connected to a tracing network and publishing port 16686, the default web UI port
Run Jaeger:
docker-compose -f labs/jaeger/jaeger.yml up -d
Browse to the Jaeger UI at http://localhost:16686; hit the Search menu at the top and refresh your browser page. This shows all the services which have sent spans to Jaeger, and the names of the operations in the spans.
You'll see the Service dropdown has a new entry - click it, select the service jaeger-query and hit the Find Traces button.
Click on the first trace in the list and expand the details, it will look something like this:
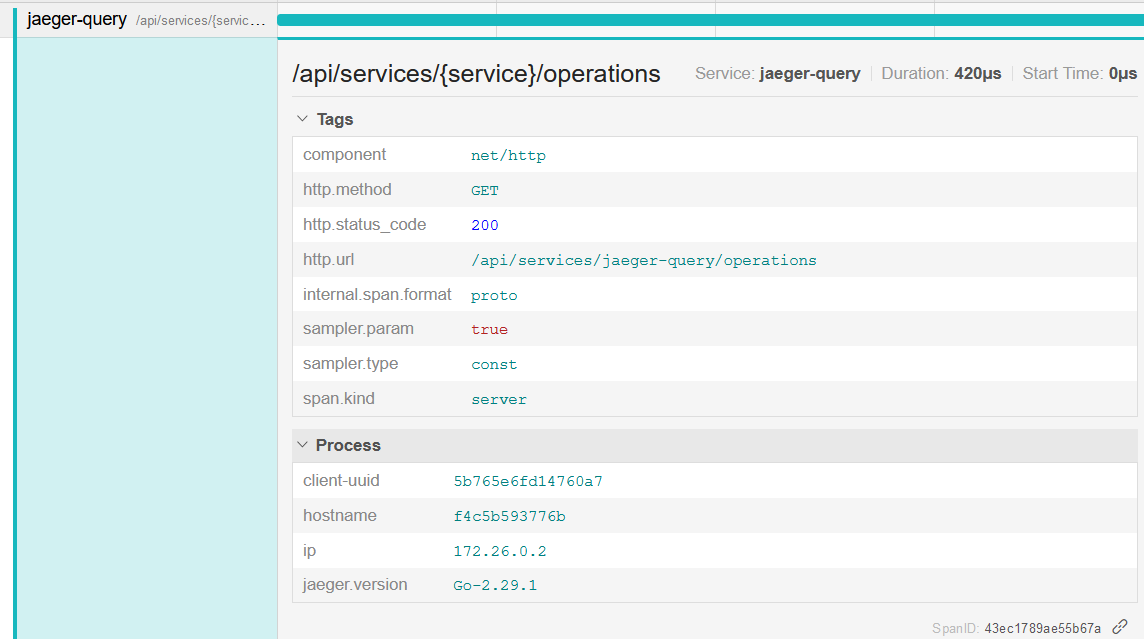
📋 What generated this trace, and what information does it give you?
Need some help?
Jaeger records traces itself - we're seeing the call to the API from the web UI, to list the operations that have been stored.
There's a single span in the trace, so we can see that the API responds without making any further HTTP calls.
The span records tags which are very similar to the ones we've seen from the tracing lab exercises, things like:
- http.method: GET
- http.status_code: 200
- span.kind: server
Tags are a collection of key-value pairs which you can set in your spans to record additional information. There are some common tags which you'll see across components, but the collection is arbitrary and you can add whatever data is useful in your spans.
The trace timeline is the most useful view in Jaeger, but you can also switch to other views of the same data. In the dropdown at the top-right of the screen, switch from Trace Timeline to:
- Trace Statistics - to see low-level timing details about the spans
- Trace JSON - to see the full log data
All the views are more useful when you have traces recording multiple spans across different components.
Exporting traces to Jaeger
The demo application we'll use has three components which are all set up with distributed tracing with OpenTelemetry:
- apps.yml - specifies containers for the web application, document service API and an authorization service API. They're all configured to send trace spans to the Jaeger container.
Run the application containers:
docker-compose -f labs/jaeger/apps.yml up -d
Browse to the home page for the web UI at http://localhost:8070, and then refresh your Jaeger search at http://localhost:16686/search.
You should see two services in the list now -
jaeger-queryandFulfilment.Web.
📋 Open the trace for the homepage request to the web application. How many spans are in this trace?
Need some help?
In the search UI set the Service to Fulfilment.Web and the Operation to /. Click Find Traces and you should see a single result.
Open that trace and expand the details. There's just one span which is the server response to your browser request.
Traces are compiled from the spans Jaeger collects. There's no advance detail of what to expect from which service, it's all built retrospectively from whichever spans made it to Jaeger.
A trace with a single span is perfectly valid - it means there were no other HTTP requests in the call chain.
Now browse back to the document list page and hit Go, using the default value for the user field.
📋 Find the trace for your new request. Does this have more spans?
Need some help?
In Jaeger search you'll see a lot more services. We still want Fulfilment.Web but it's not always clear which operation you want, so you can select all for the operation and hit Find Traces.
The one you want is listed with multiple spans from multiple services.
Open the trace and expand the details, and you'll see the real value of adding tracing to your apps:
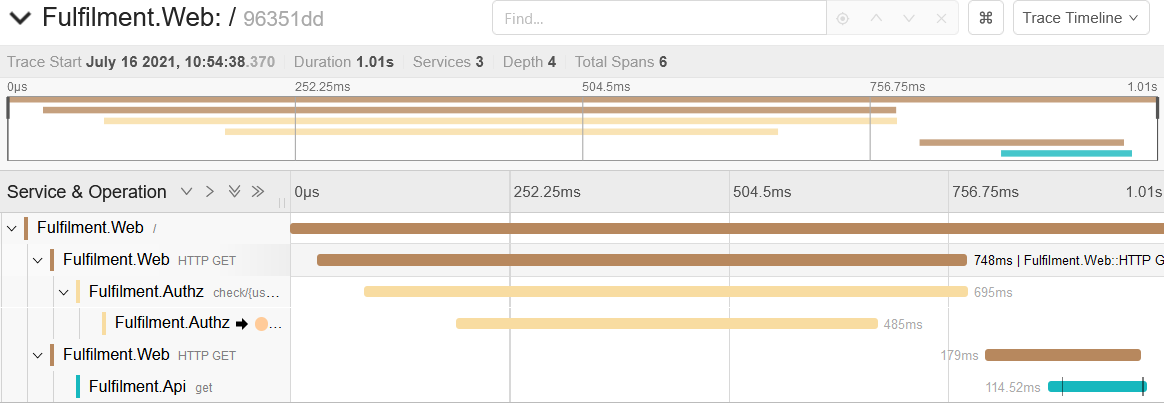
The graph at the top shows the total trace duration, and within that the duration for each span. In this example the whole request took 1.01 seconds, and you can clearly see the web app makes two consecutive HTTP calls.
Below the graph you get the details of each span, which you can expand to see the tags and any additional information.
📋 What is the call trace when you got the document list - and which part of the call takes the most time?
Need some help?
Expand all the spans and you'll see a lot of detail:
-
the web app receives a POST request from the user clicking the button
- this is the topmost span, which is a server response to the client
-
the web app calls the authorization service
- there are two spans here because both components capture traces - the client call from the web app, and the server response from the authorization service
-
the authorization service calls an external web address (my blog, actually)
- just a single span here, the client call from the authorization service, because we don't get trace details from the blog server
-
the web app calls the document service
- two spans again here as both components record trace spans, the client call from the web server and the server call from the API server
The longest call in the chain is the external request to https://blog.sixeyed.com.
The application components use OpenTelemetry libraries to record and send trace spans for incoming and outgoing HTTP calls. They're using different technologies (ASP.NET and Spring Boot), but the tracing format is the same so Jaeger can compile all the spans into the correct trace.
None of the apps required any extra code to collect and send traces, other than wiring in the instrumentation library:
-
for the .NET app that's done in the
AddTracingextension method in the Tracing class -
for the Spring Boot app it's done without code by using the
opentracing-spring-jaeger-web-starterpackage, referenced in pom.xml
Lab
Distributed tracing is great for exploring the internal structure of features in an unfamiliar app.
Browse to the Submit document page on the web app and click Go using the default field values on the page.
Use Jaeger to plot the call stack for submitting documents; which method on which class actually creates the document?
Cleanup
Cleanup by removing all containers:
docker rm -f $(docker ps -aq)